S&P 500 Index after making a new high has now started showing some weakness. RSI 14 Negative Diversion is clearly seen on Daily Charts.
Price action at the top also suggesting that Bears are taking charge.
For Short term, I’m expecting that Price should retest the support zone of 2400-2360 levels. One can go short below 2430 with SL 2455
Below are the charts for your reference.


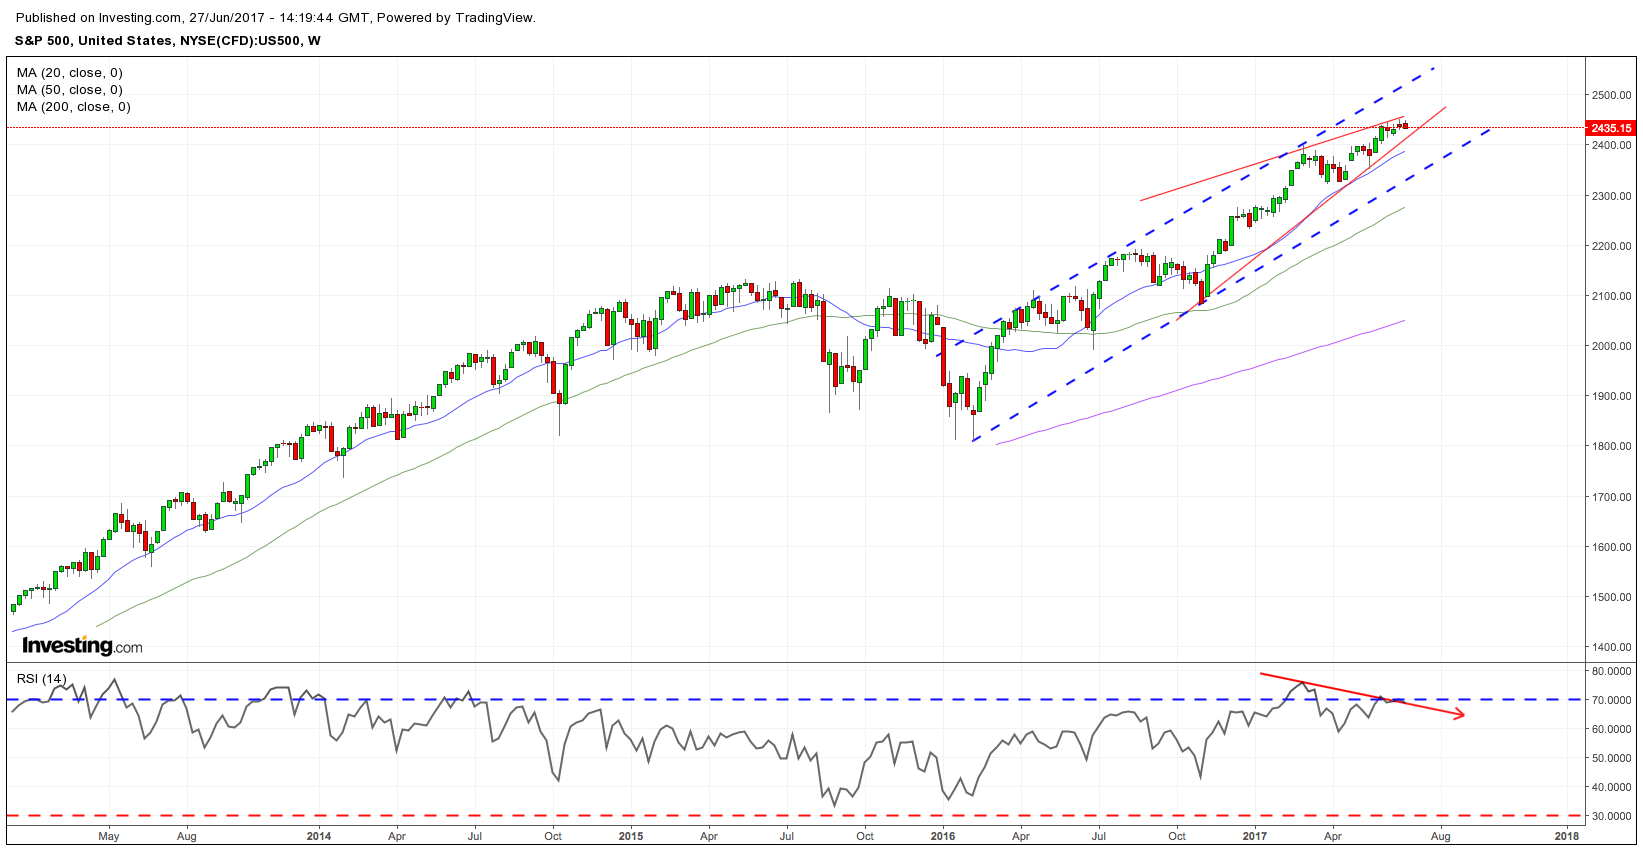
On Weekly Charts, There is a rising wedge and RSI 14 Negative Diversion too. A chart is below for the reference.
Disclaimer
I’m not a SEBI Registered Investment Advisor. Above Views are only for Educational Purpose. Equity, Commodity & Currency Trading has large potential rewards, but also Large Potential Risk. You must be aware of the risk and willing to accept them in order to invest in the markets. Don’t trade with the money you can’t afford to lose. This page is neither a solicitation nor an offer to acquire/sell any script. Please consult your financial advisor to take appropriate investments as per your risk profile. The past performance of any investments is not an indication for future returns.
Leave a Reply