Dear All,
It’s been a nice one-sided month of Feb and March. Bears active all around.
Now the question arises what next?
Let’s focus on charts and see what price is offering.
Below are the charts for your reference.

On Hourly Chart, Price is perfectly moving in a parallel channel. Channel Resistance at 10300.

On Daily Chart, Price perfectly took support at confluence zone.There is an RSI(14) positive divergence.
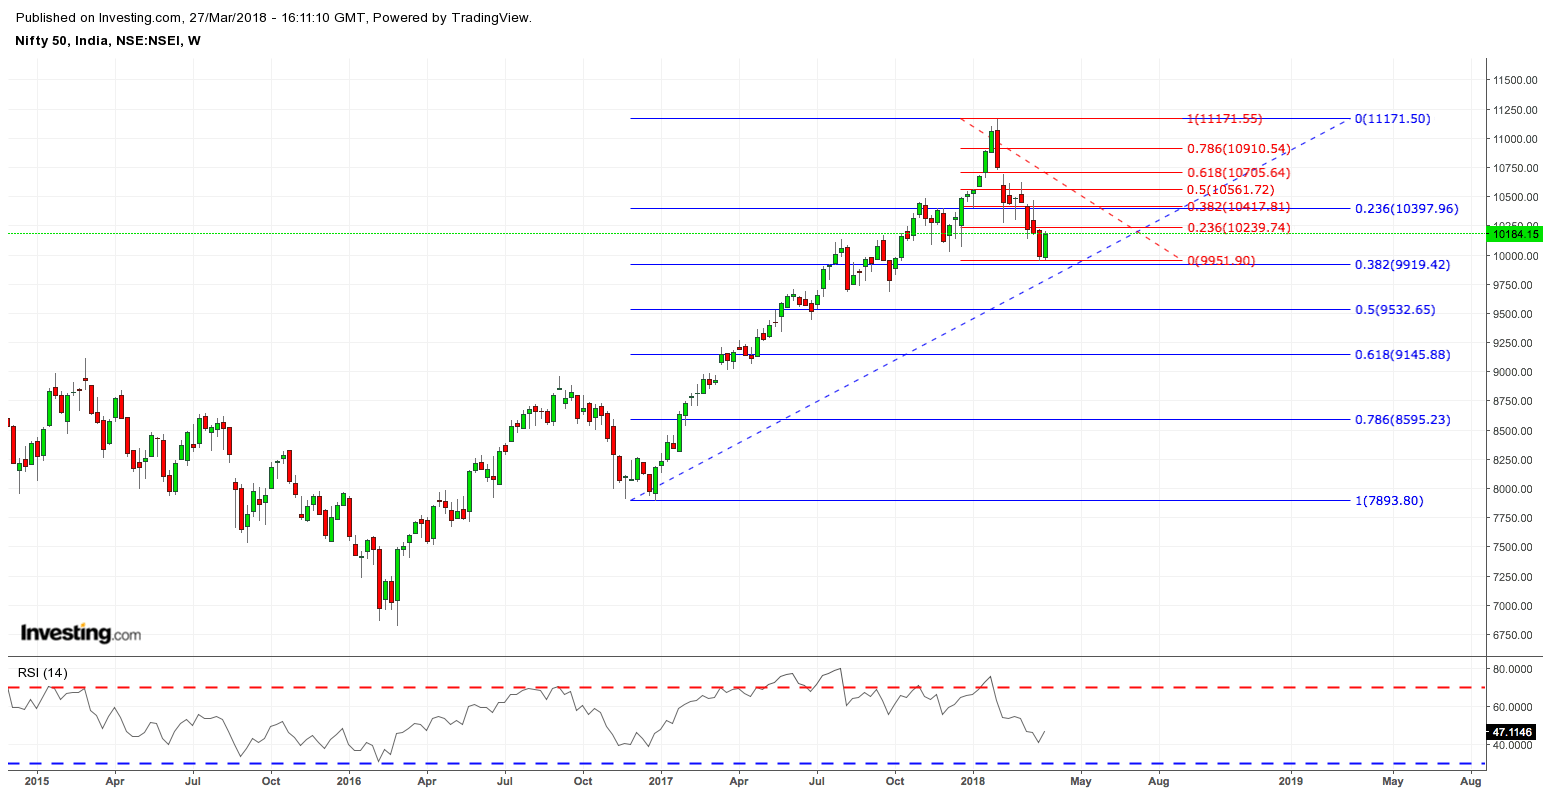
On Weekly chart price perfectly took support at 38.2% fib ratio and now important to see tomorrow’s expiry, If the price goes above 10300 then you can expect further rally till 10500 levels.
Trade Setups are –
Buy above 10210 spot levels for Target 10300-350-400 levels with SL 10140
Sell Below 10140 spot levels for Target 10070-10020 level with SL 10210.
Cheers
Sid
Disclaimer
I’m not a SEBI Registered Investment Advisor. Above Views are only for Educational Purpose. Equity, Commodity & Currency Trading has large potential rewards, but also Large Potential Risk. You must be aware of the risk and willing to accept them in order to invest in the markets. Don’t trade with the money you can’t afford to lose. This page is neither a solicitation nor an offer to acquire/sell any script. Please consult your financial advisor to take appropriate investments as per your risk profile. The past performance of any investments is not an indication for future returns.
Leave a Reply